Forecasting community water system outages
We forecasted the impact of drought on community water systems.
Problem statement
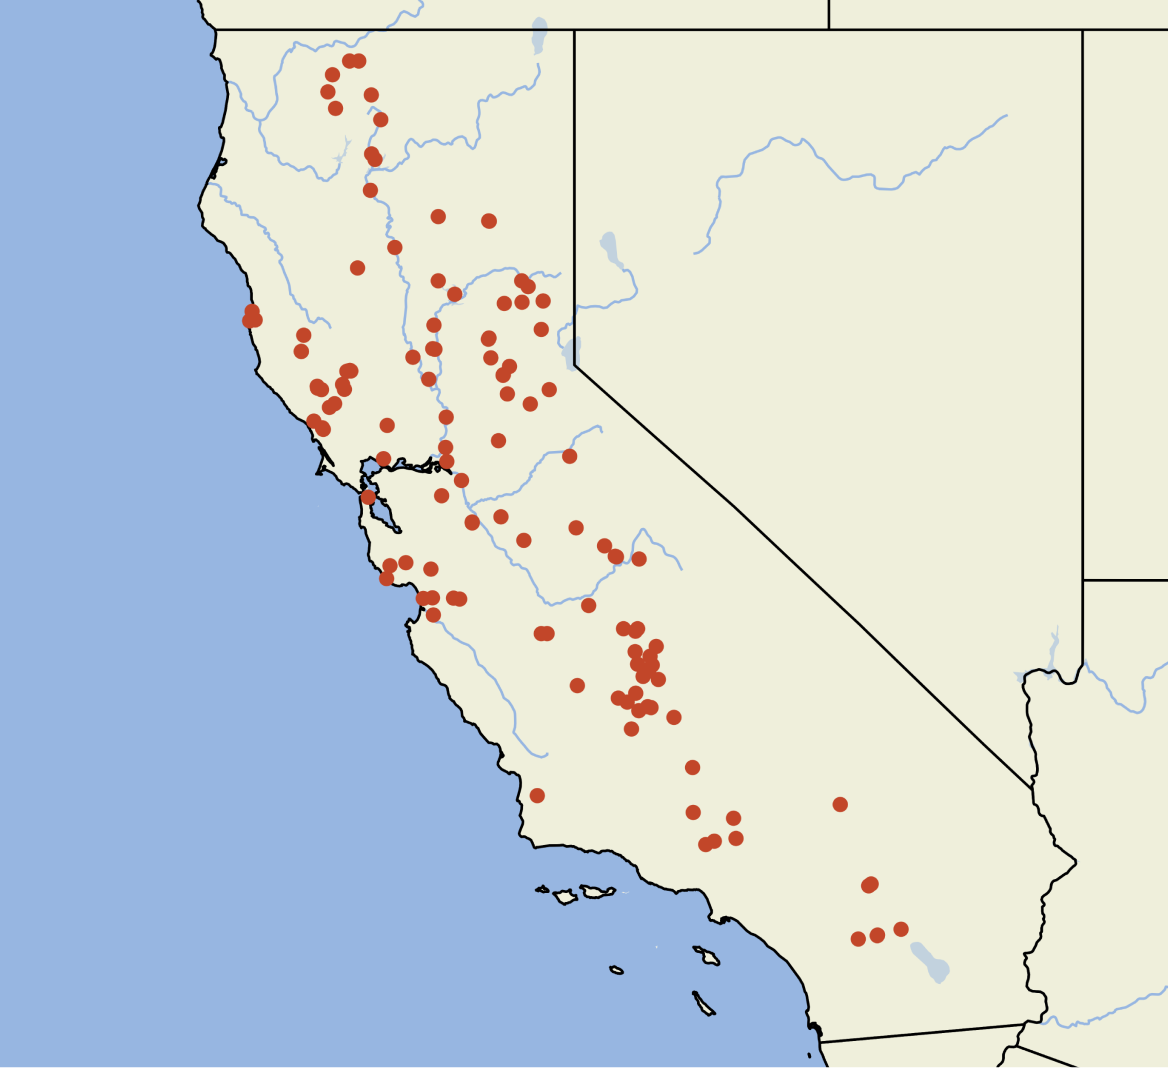
The Division of Drinking Water (DDW) monitors 2,866 community water systems across California. Every year, a small fraction of these water systems run out of water. This causes a major public health emergency for the communities served by these systems. In some cases, communities run out of water and the DDW provides funding for deliveries of bottled or hauled water.
With a few months of advance notice about which communities might face problems, the DDW could investigate and mitigate issues beforehand as well as preposition resources. This motivated the DDW to take a proactive approach by developing a model to forecast drought impacted water systems. In early 2022, the model identified 510 community water systems likely to run into an issue. But investigating all 510 water systems would take too many resources, while investigating less may potentially miss problematic systems. So DDW approached ODI to improve and streamline the modeling process.
Our approach
Data
Forecasting the impact of drought on community water systems requires modeling three processes. One, an infrastructure process that describes the flow of water throughout the network of water systems in California. Two, a physical process that describes the flow of groundwater, through rocks and soil and the flow of surface water through streams, rivers, and reservoirs. Three, readily available drought indicators that summarize regional drought stress over time.
To capture elements of these processes, we used three categories of data. One category describes how interconnected the water system is to other nearby water systems. Researchers show that many systems fail because they rely on only one source of water (Mullin, 2020). Another category of data describes the location, along with characteristics of surface water watersheds and ground water basins, of each water system related to the hydrology or movement of water above and below ground. Finally, we used a Drought Severity and Coverage Index which quantifies U.S. Drought Monitor statuses on a weekly basis using a scale from zero to 500 for any county, summarizing drought severity and coverage over time through a weighted sum approach.
Our dataset describes 2,866 water systems over two years, from 2021 to 2023. We use fifteen features and one outcome to describe each system. Most community water systems in our sample, 96%, were resilient to drought. Four percent experienced some effects: these systems ran out of water, sustained themselves on bottled or hauled water, experienced a drought violation, or requested continued use of a source that was legally curtailed.
Method
To find an empirical relationship between the features that describe each water system and its outcome, we used a machine learning model called a Support Vector Machine (Cortes & Vapnik 1995; Pedregosa, 2011). The model plots all the data – not on a two- or three-dimensional plot, but a 15-dimensional hyperspace – and draws a plane, called decision boundary, separating the drought-impacted and drought-resilient water systems. In general, the drought-impacted systems lie on one side of the decision boundary and the drought-resilient ones on the other.
To forecast future outcomes, we take a community water system – for which we do not know the outcome – calculate all fifteen features and plot it in the hyperspace. If the point is on the resilient side of the decision boundary, we forecast that the system will be safe. Otherwise, we forecast that it will be impacted.
But ultimately, we want to know: Why did the model draw a decision boundary where it did? Why does it place some water systems on the impacted side and others on the resilient side? To answer these questions, we used an interpretable machine learning method called counterfactual examples (Mothilal et al., 2020). It asks: What if? What if this community water system had more water sources? What if there was more rain last year? Then we ask the model to forecast the outcome for this hypothetical system. This process allows us to identify exactly what changes in the input data cause a change in the outcome.
Impact
We assessed nearly two dozen datasets. But most data sources required extensive manual cleaning. Some were also inconsistent over time or included missing data. We also discovered that many of these datasets contained static variables, or values that stay constant over time. Using static variables would result in the same forecast year after year. To address these problems, we selected a consistent subset of data, and only required little manual cleaning. We also developed a stronger reliance on dynamic variables that reflect drought conditions over time. We needed now to develop a model which could be run more frequently with minimal staff involvement, that was easy to use and understand, and that was ethical in its determinations.
The model, which is designed to run each spring and identify issues that may arise during the dry summer months, now produces an output that spurs action. Community water systems can anticipate and fix problems before they start. The model can be configured to run even more frequently and with less staff time investment depending on the structure of the data being used.
As a result, the model is easy to use, interpretable, and ethical. The model is easy to use and understand. Researchers can continually experiment with this initial model, which is publicly available, by adding more data sources and improving the model. By probing the output of the model with 'What if' questions, researchers can easily explain forecasts and build trust with the community. Finally, we vetted the model through an ethics toolkit, which assesses the historical and technical risk associated with each dataset, the reproducibility and interpretability of the algorithm itself, and the impact of the model on communities within California. Using these assessments, we developed mitigation strategies and recommendations.
Recommendations
The biggest improvement in model performance will come from improving the data quality, quantity, and accessibility. We recommend that the DDW take three steps toward these improvements.
1. Build a modern data platform
2. Use more data
3. Experiment rapidly
Develop a centralized database, together with automatic tools that check for data quality and errors.
Collect and ingest data automatically so it saves staff time.
Use time-varying data taken on a frequent cadence. In addition, use historical data.
In the future, proactively and continually collect data – not just during drought years.
Quickly experiment with different data sources and model architectures.
Create reproducible results.
First, we recommend building a modern data platform. In other words, to develop a centralized database that ingests data along with automatic tools that check for errors. We also recommend reducing any reliance on manual data collection. Collecting data automatically will take less staff time and reduce errors.
Second, we recommend using more data. Proactively and continually collecting data, not just during drought years, allows researchers to make accurate forecasts during varied drought conditions. Incorporating additional satellite and ground-based observations (such as relative soil moisture and stream flow measurements) instead of relying on index data, which are not in physical units, enables researchers to develop a model that is even easier to understand.
These two recommendations enable researchers to query data of interest, rapidly experiment, and improve models. For example, some experimental algorithms could include network models (e.g. Albert & Barabási, 2002), which can model the dynamics of an infrastructure system by accounting for the number of connections per node. Another option, after collecting data at a higher cadence, includes time-series algorithms. Rapid experimentation shortens the amount of time between developing a simple prototype to a reliable, robust, and effective model that forecasts the impact of drought on community water systems throughout California. Together, DDW and ODI can make California communities more resilient to drought.
References
Albert, R., & Barabási, A. L. (2002). Statistical mechanics of complex networks. Reviews of modern physics, 74(1), 47. https://doi.org/10.1103/RevModPhys.74.47
Cortes, C., & Vapnik, V. (1995). Support-vector networks. Machine learning, 20, 273-297. https://doi.org/10.1007/BF00994018
Mothilal, R. K., Sharma, A., & Tan, C. (2020, January). Explaining machine learning classifiers through diverse counterfactual explanations. In Proceedings of the 2020 conference on fairness, accountability, and transparency (pp. 607-617). https://doi.org/10.1145/3351095.3372850
Mullin, M. (2020). The effects of drinking water service fragmentation on drought-related water security. Science, 368(6488), 274-277. https://doi.org/10.1126/science.aba7353
Fabian, P. (2011). Scikit-learn: Machine learning in Python. Journal of machine learning research 12, 2825. https://jmlr.org/papers/volume12/pedregosa11a/pedregosa11a.pdf
Code
Authors
Roles use the CRediT taxonomy.