A data-driven approach to detecting cash benefit theft
We built a predictive model to detect illegal debit card transactions.
Problem statement
The California Department of Social Services (CDSS) disburses cash benefits, through a welfare program called CalWORKs, to about 860,000 people every month. The disbursement mechanism, called Electronic Benefits Transfer (EBT), loads cash aid onto a debit card. Recipients can then withdraw cash at Automated Teller Machines (ATMs) or Point of Sale (POS) terminals.
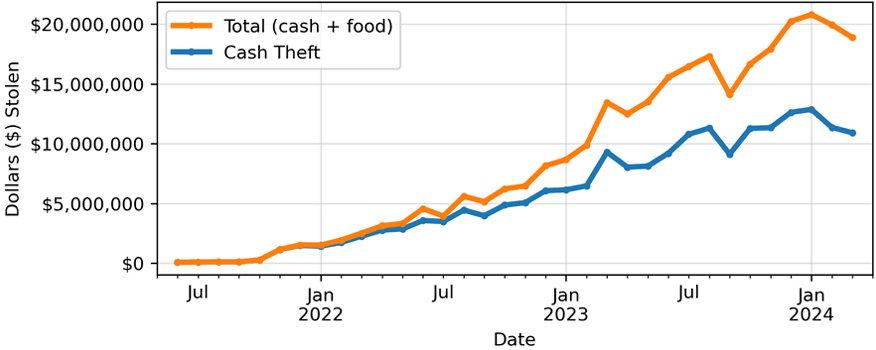
Criminal organizations steal CalWORKs participants’ EBT account information and use that information to complete unauthorized transactions, henceforth called theft. Between June 1, 2021, and March 31, 2024, CalWORKs lost $194 million to theft. The program was losing approximately $13 million dollars a month. CDSS has been working on several strategies to combat theft, which is a national problem. Most EBT theft mitigation strategies require good data and research. To understand this problem, the CDSS Research Automation and Data Division (RADD) wanted to scrutinize transaction data to identify patterns of suspicious transactions but encountered 2 main challenges. First, they had limited access to the transaction data, and the data they could get took significant time to access and process. Second, they didn’t have any insight into which transactions were theft.
The Office of Data and Innovation (ODI) helped CDSS identify theft patterns by obtaining multiple datasets, transforming these data, and developing a machine learning model to detect benefit theft.
Data
For this work, we focused on the problem of detecting illegal cash withdrawals. We used 2 datasets that spanned the time period between December 1, 2023, and March 31, 2024. First, we used transaction data that describe each transaction per cardholder. During this 4-month period (December 2023 through March 2024), about 562,000 households withdrew roughly $1.38 billion in cash at 33,000 locations. Second, we used reimbursement data that detail cash reimbursements to victims of unauthorized activity. During the same period, CDSS reimbursed 42,849 households for $47 million in unauthorized transactions.
To obtain these data, CDSS worked with the Office of Technology and Solutions Integration, within the California Health and Human Services Agency, to develop a work plan with the vendor to provide automated daily batches of raw EBT transaction data to secure cloud storage managed by the CDSS Information Systems Division (ISD). We then created an automated data pipeline that loads the raw data into the RADD team’s data warehouse, where it undergoes a series of cleaning and transformation steps to turn it into a nicely structured, machine-learning-ready dataset. We run these steps daily alongside a series of automatic tests that validate the process.
We found that the account activity data included a complete address for only 66% of cash withdrawal locations (ATMs and POS terminals). To fix this issue, we used a service from Environmental Systems Research Institute, Inc. (Esri), that matches partially complete addresses to complete ones and provides geographic coordinates for each address. Using this tool, we obtained a complete address, along with geographic coordinates, for 95% of the retailers in the account activity data. We integrated this API directly into the CDSS Enterprise Data Pipeline so it runs automatically.
We also learned that the reimbursement data included lump-sum reimbursements for multiple transactions, i.e., the number and value of reimbursement transactions do not map 1:1 to the number and value of theft transactions. This makes it difficult to pinpoint the individual unauthorized transactions for which the customer was reimbursed. Identifying these transactions is central to both understanding where theft occurs and training a model to predict which transactions are theft. To address this issue, we developed a 3-step methodology to infer these individual unauthorized transactions. First, we identify the reimbursement date and cardholder from the list of reimbursements. Next, we select all the cardholder's transactions, from the transaction data, in the month before the reimbursement. Finally, we assign a label. If there are up to four transactions within a 24-hour period that, together, add up to the reimbursement amount, we label those transactions as unauthorized. Otherwise, we label the transactions as legitimate.
Model
We constructed 20 characteristics, or features, that describe each transaction. Some features describe location characteristics – such as distance between the customer and the retailer, or ATM, where the transaction took place. Others describe the retailer – such as the number of withdrawals at an ATM prior to the transaction of interest. Others describe temporal characteristics – such as whether the transaction took place in the morning or on the weekend.
To find a relationship between these features and suspicious activity, we used a machine learning algorithm called a random forest from version 1.4.1.post1 (Grisel et al. 2024) of the open-source scientific software package scikit-learn (Pedregosa et al. 2011). Our random forest model consisted of 1,000 decision trees. Each tree consists of a series of if-else decision points that terminate in a final outcome. For example, one decision point could ask the question: Did the transaction happen over the weekend? An answer of yes will lead to another question, while an answer of no will lead to a different question. Eventually, the series of questions and answers will terminate in one of 2 outcomes: that a transaction is allegedly illegal or legitimate. We trained the ensemble of decision trees, or random forest, on 64%, or roughly 2.5 months, of data, and tested it on the rest. The random forest outputs the average prediction of the ensemble members as a probability of theft. To convert this to a binary value, we applied a threshold of 35% – that is, we predict transactions with a probability greater than or equal to 35% are theft and those with a lower probability are legitimate – to minimize the number of false positives.
Our data include two groups of transactions: legitimate, authorized transactions, which comprise 99% of the dataset, and theft, or unauthorized transactions. Only 1% of our dataset describes theft. Machine-learning models trained on severely imbalanced datasets like this tend to ignore the minority group in favor of the majority one (see, for example, Chapter 6 of Le Borgne et al., 2002). To address this problem, we subsampled the majority group to reduce the imbalance from roughly 1% to 5% while ensuring that the distribution of the subsampled majority-group examples is nearly identical to the full distribution via a Kolmogorov-Smirnov test. The random forest model also penalizes misclassifications of the minority group five times more than misclassifications of the majority one.
Calculating the accuracy of the predictions – that is, how often a model was right – on an imbalanced dataset can be deceptively positive. For example, simply predicting that every transaction is legitimate would lead to an accuracy of 99%, but this model would have no skill in predicting theft. Instead, we calculated how often the model correctly identified an unauthorized transaction. In our case, this value, also known as the True Positive Rate, is 82%. For a model trained on an imbalanced dataset like this one, where 1% of the data describe theft, a True Positive Rate of 82% indicates a fairly high predictive capacity. In our recommendations section, we outline future ways to improve the model.
Finally, we implemented a method called counterfactual examples to understand how each individual feature of the model contributes to the overall probability of theft.
Counterfactual examples perturb the input example until the model produces a different outcome (for example, Mothilal et al. 2020). We quantify the change in probability per change in value for any given feature by looking at the difference in the original and perturbed example. Perturbations of the most predictive feature resulted in the largest change in probability. The most predictive features are omitted in this article for operational security reasons.
Impact
Here we describe the impact of this collaborative effort.
- Built capacity. CDSS now has increased capability to use large datasets, cloud computing, and machine learning algorithms to fight benefit theft.
- Reduced the lag time in measuring EBT theft by 95%, from 2 months to 72 hours. This means CDSS can deliver more timely information on the scale and trend of EBT theft to all stakeholders.
- Reduced the time staff spent collecting and preparing data for analysis by 100%. This saves 2,160 staff hours annually. Now CDSS staff can conduct more research and run more experiments.
- Improved ability to correctly identify specific unauthorized transactions. The machine learning model correctly identifies 82% of unauthorized transactions. Crucially, CDSS can also explain why a transaction is flagged.
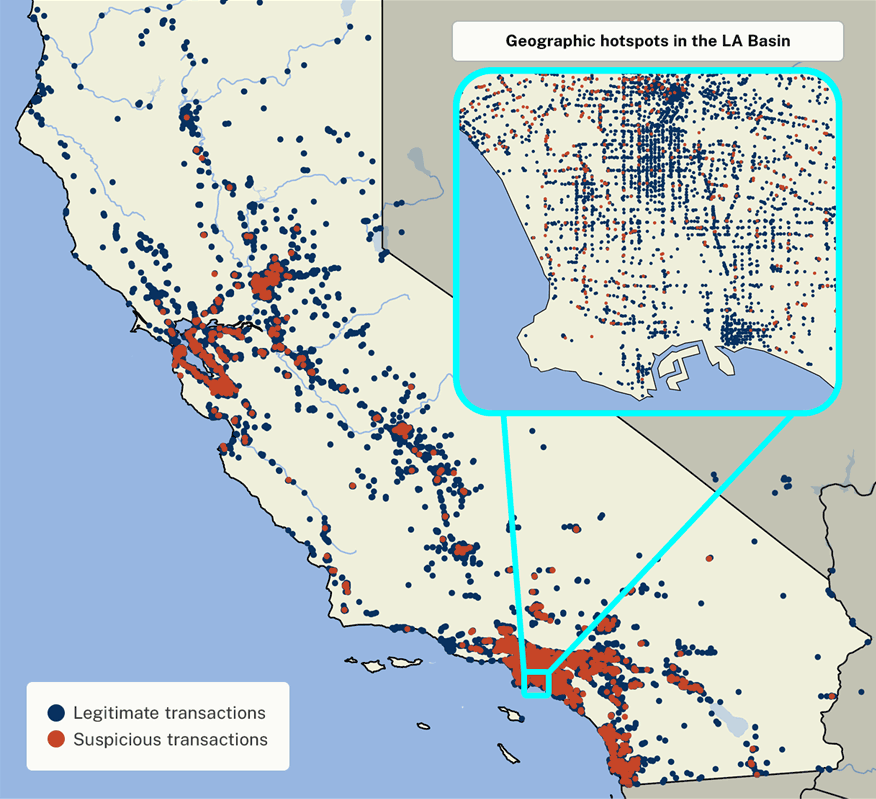
- Improved awareness about where EBT theft occurs. CDSS can now identify geographic theft hotspots because they know the geographic coordinates for each transaction.
What’s next
This work is far from over. CDSS will build off this project in several ways to better fight EBT theft with well-designed and -timed interventions.
Use the data pipeline and modeling to identify where and when EBT theft occurs, which cards are compromised, and where skimmers might be located. Use these insights to target interventions to protect benefits. At least 1 theft prevention intervention has been implemented based on this work, and more are in development.
Monitor the impact of upgrades to EBT card technology. California is the first state in the nation to roll out chip and tap cards for EBT benefits.
Explore how time-series forecasting may improve our labeling of theft transactions by better capturing temporal dependence and trends. Right now, our model mostly considers each data point as temporally independent.
Extend this modeling work to also identify which food purchase transactions are theft events. This work was focused on labeling which cash withdrawal transactions were theft, but future efforts will attempt to use this data pipeline to model food theft transactions.
Continue to improve this data pipeline over time by refining our methodology to obtain complete addresses and carrying out additional data engineering.
References
Chawla, Nitesh V., et al. "SMOTE: synthetic minority over-sampling technique." Journal of artificial intelligence research 16 (2002): 321-357. https://doi.org/10.1613/jair.953
Fabian, Pedregosa. (2011). Scikit-learn: Machine learning in Python. Journal of machine learning research 12, 2825. https://jmlr.org/papers/volume12/pedregosa11a/pedregosa11a.pdf
Grisel, Oliver et al. (2024). scikit-learn/scikit-learn: Scikit-learn 1.4.1.post1 (1.4.1.post1). Zenodo. https://doi.org/10.5281/zenodo.10666857
Grover, Prince, et al. "Fraud Dataset Benchmark and Applications." arXiv preprint arXiv:2208.14417 (2022). https://arxiv.org/abs/2208.14417
Le Borgne et al. "Reproducible Machine Learning for Credit Card Fraud Detection", 2002. https://fraud-detection-handbook.github.io/fraud-detection-handbook/
Mothilal, R. K., Sharma, A., & Tan, C. (2020, January). Explaining machine learning classifiers through diverse counterfactual explanations. In Proceedings of the 2020 conference on fairness, accountability, and transparency (pp. 607-617). https://doi.org/10.1145/3351095.3372850
Office of Data and Innovation. “Data and Innovation Fund.” innovation.ca.gov, 11 September 2024, https://innovation.ca.gov/data-and-innovation-fund.
Authors
Roles use the CRediT taxonomy.