Building housing intelligence for California
The Office of Data and Innovation (ODI) built a tool to more accurately track the housing development pipeline so California can build more housing faster.
Problem statement
Currently, California has an ambitious goal of permitting the construction of 2.5 million homes by 2030 with 1 million homes being affordable for lower income levels. While significant progress has occurred since that target was set in 2022, there is still more that can be done to permit and build more affordable housing faster.
Senate Bill (SB) 423 (D-Weiner-San Francisco), Land use: streamlined housing approvals: multifamily housing developments; Assembly Bill (AB) 2653 (D-Santiago-Los Angeles), Planning and Zoning Law: housing elements; and other housing legislation have aimed to alleviate California’s housing production shortfall by building more affordable housing faster. However, the legislation has also led to a larger volume of housing data flowing to the Department of Housing and Community Development (HCD), requiring additional data processing and validation on a shorter time frame.
This makes it a time-consuming task to answer fundamental questions such as:
- Which projects are eligible for streamlining under SB 423 (and which are not)?
- How long does it take to permit housing projects?
- How many projects are affordable? And how have trends in affordability changed over time?
These questions must be answered to build rapidly and responsibly.
Our approach
Housing production data is reported to HCD by 539 jurisdictions (cities and counties) across the state. ODI partnered with HCD to build a tool called Homestead to mine, analyze, and visualize that data so HCD staff can have in-depth, granular knowledge on the state of housing production. The housing development process itself can be mired in review and with each jurisdiction comes a different set of project identifiers, local procedures, and reporting practices.
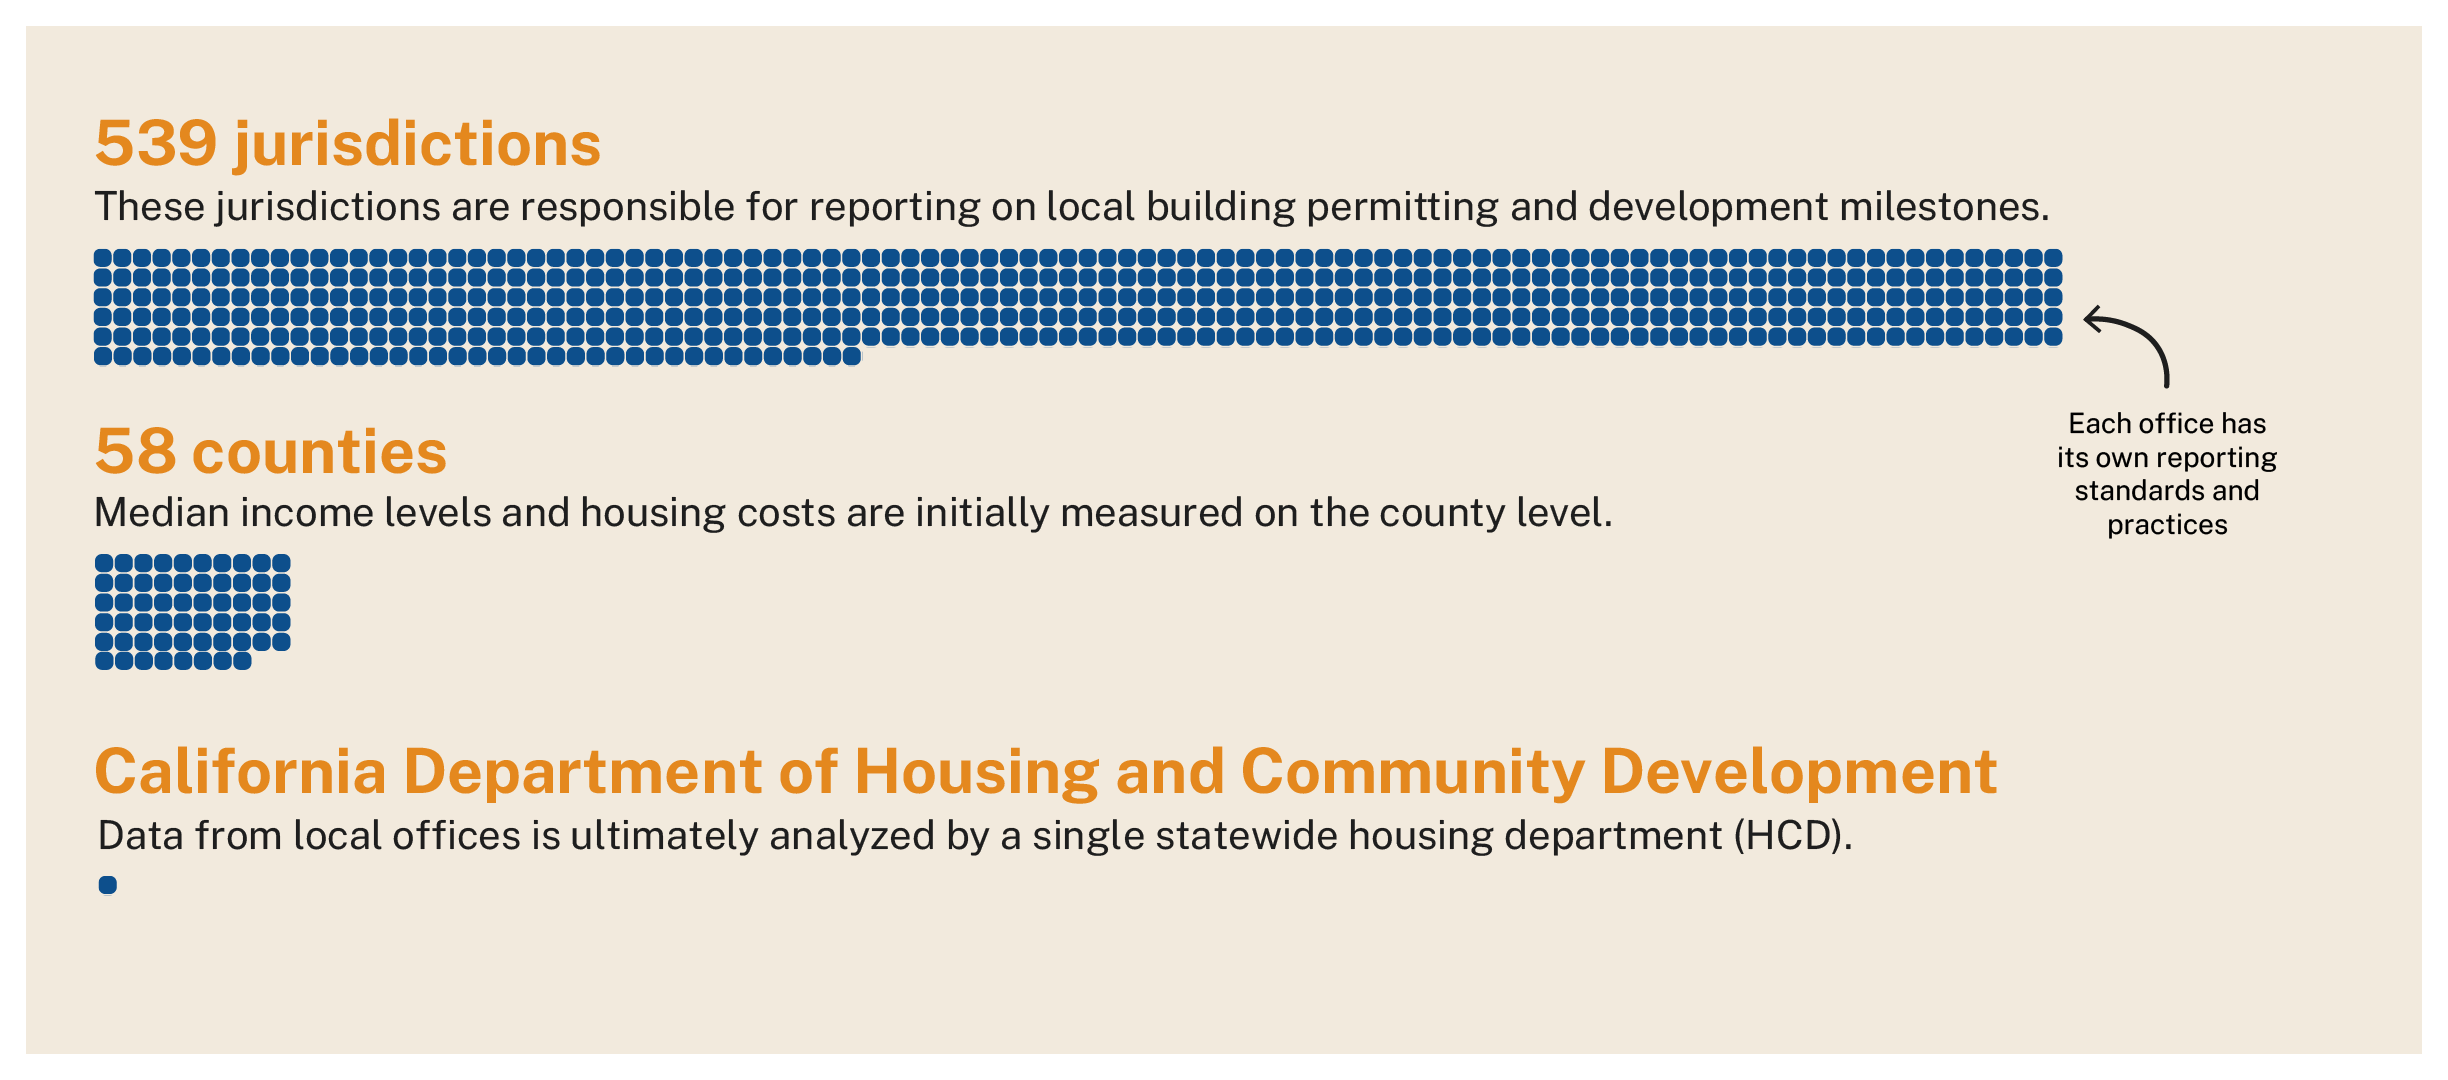
Figure 1. Both jurisdictions and counties generate data related to housing development and cost of housing. All of which is funneled to one statewide agency: the Department of Housing & Community Development.
Additionally, under AB 2653, HCD has 90 days to request corrections to reports from jurisdictions.
Building a tool to process this data and guide HCD’s analysis requires an array of functionality to: process data, detect anomalies, analyze geospatial data, and automate rote analyses. This requires a Python script that outputs new datasets derived from raw housing data and a dashboard that’s accessible department-wide.
Anomaly detection
One of the primary goals of ODI’s work was to help HCD detect outliers and idiosyncratic values easily. This saves time while maintaining flexibility for HCD staff to conduct deeper investigations. We workshopped 3 approaches to anomaly detection:
- Z-scoring: A technique that standardizes data by subtracting the mean and dividing by the standard deviation (ensuring all values share a common scale), then flagging Z-scores greater than a given threshold (typically 3).
- Isolation forest: Isolates outliers by creating binary partitions in data, identifying anomalies as data points requiring fewer partitions to separate them from the majority.
- Local outlier factor: Calculates a local anomaly score for data points based on the density of “neighbors” nearby on a graph, revealing anomalies within their local context.
We coupled the Z-Scoring approach with text processing to flag anomalous values consistently. An anomalous value might include multi-unit buildings that were reportedly built in less than a week or multiple parcels bundled together as one record. The final dashboard will have an interface for HCD staff to filter for and export projects with anomalous values.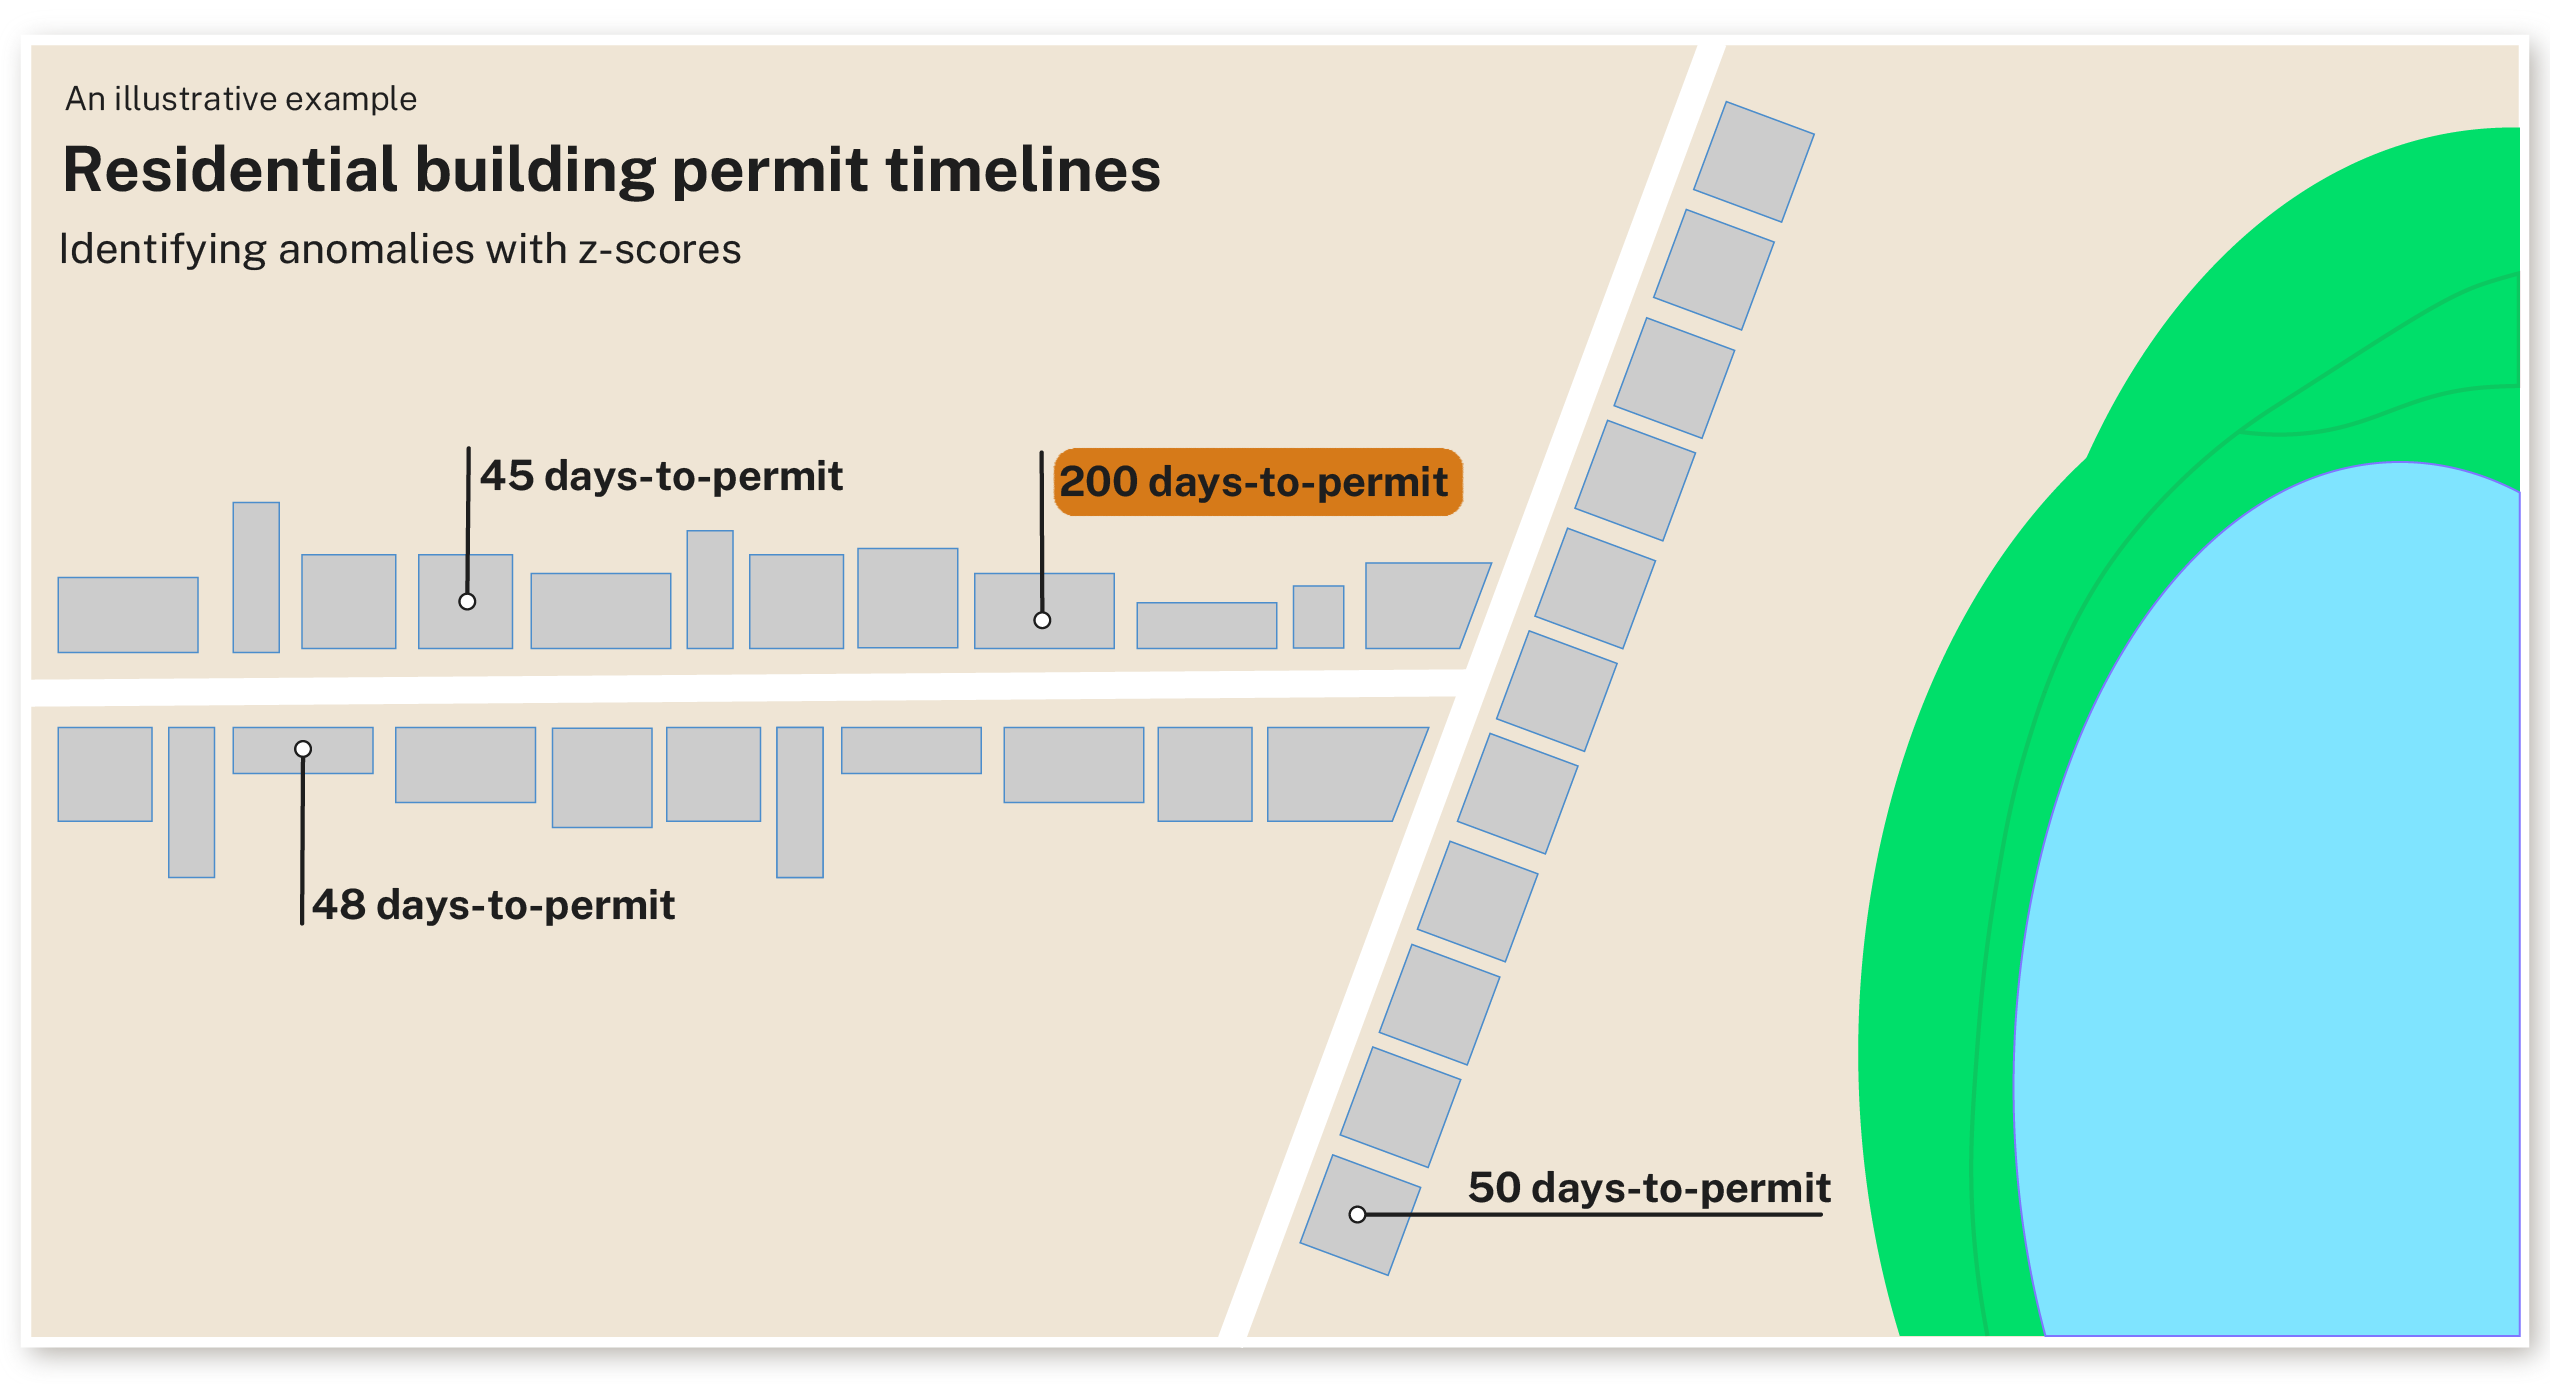
Figure 2. Using development milestones like permit issuance and certificate of occupancy dates, we can flag developments with inordinately long timelines relative to comparable constructions.
Geospatial analysis
One of the greatest challenges to making sense of housing data is the inconsistency between geographic data and jurisdiction-reported data. The inconsistency makes it impossible for a human to efficiently detect which projects are eligible for streamlining under SB 423 and which are not eligible for streamlining because they are in sensitive areas (for example, fire hazard, seismic hazard, or important farmland). We built a process to parse addresses, find the addresses’ coordinates, and map them against environmentally sensitive zones:
- Geolocation functionality: Map every project’s physical street address reported by jurisdictions (for example, 123 Main St. Los Angeles, CA 90720) to a latitude and longitude
- Shape processing: Ingest and simplify shape files that represent California’s protected zones
- Spatial joining: Map projects and protected zones to see which projects intersect with protected zones. Those that do not and meet SB 423 criteria are eligible for streamlining
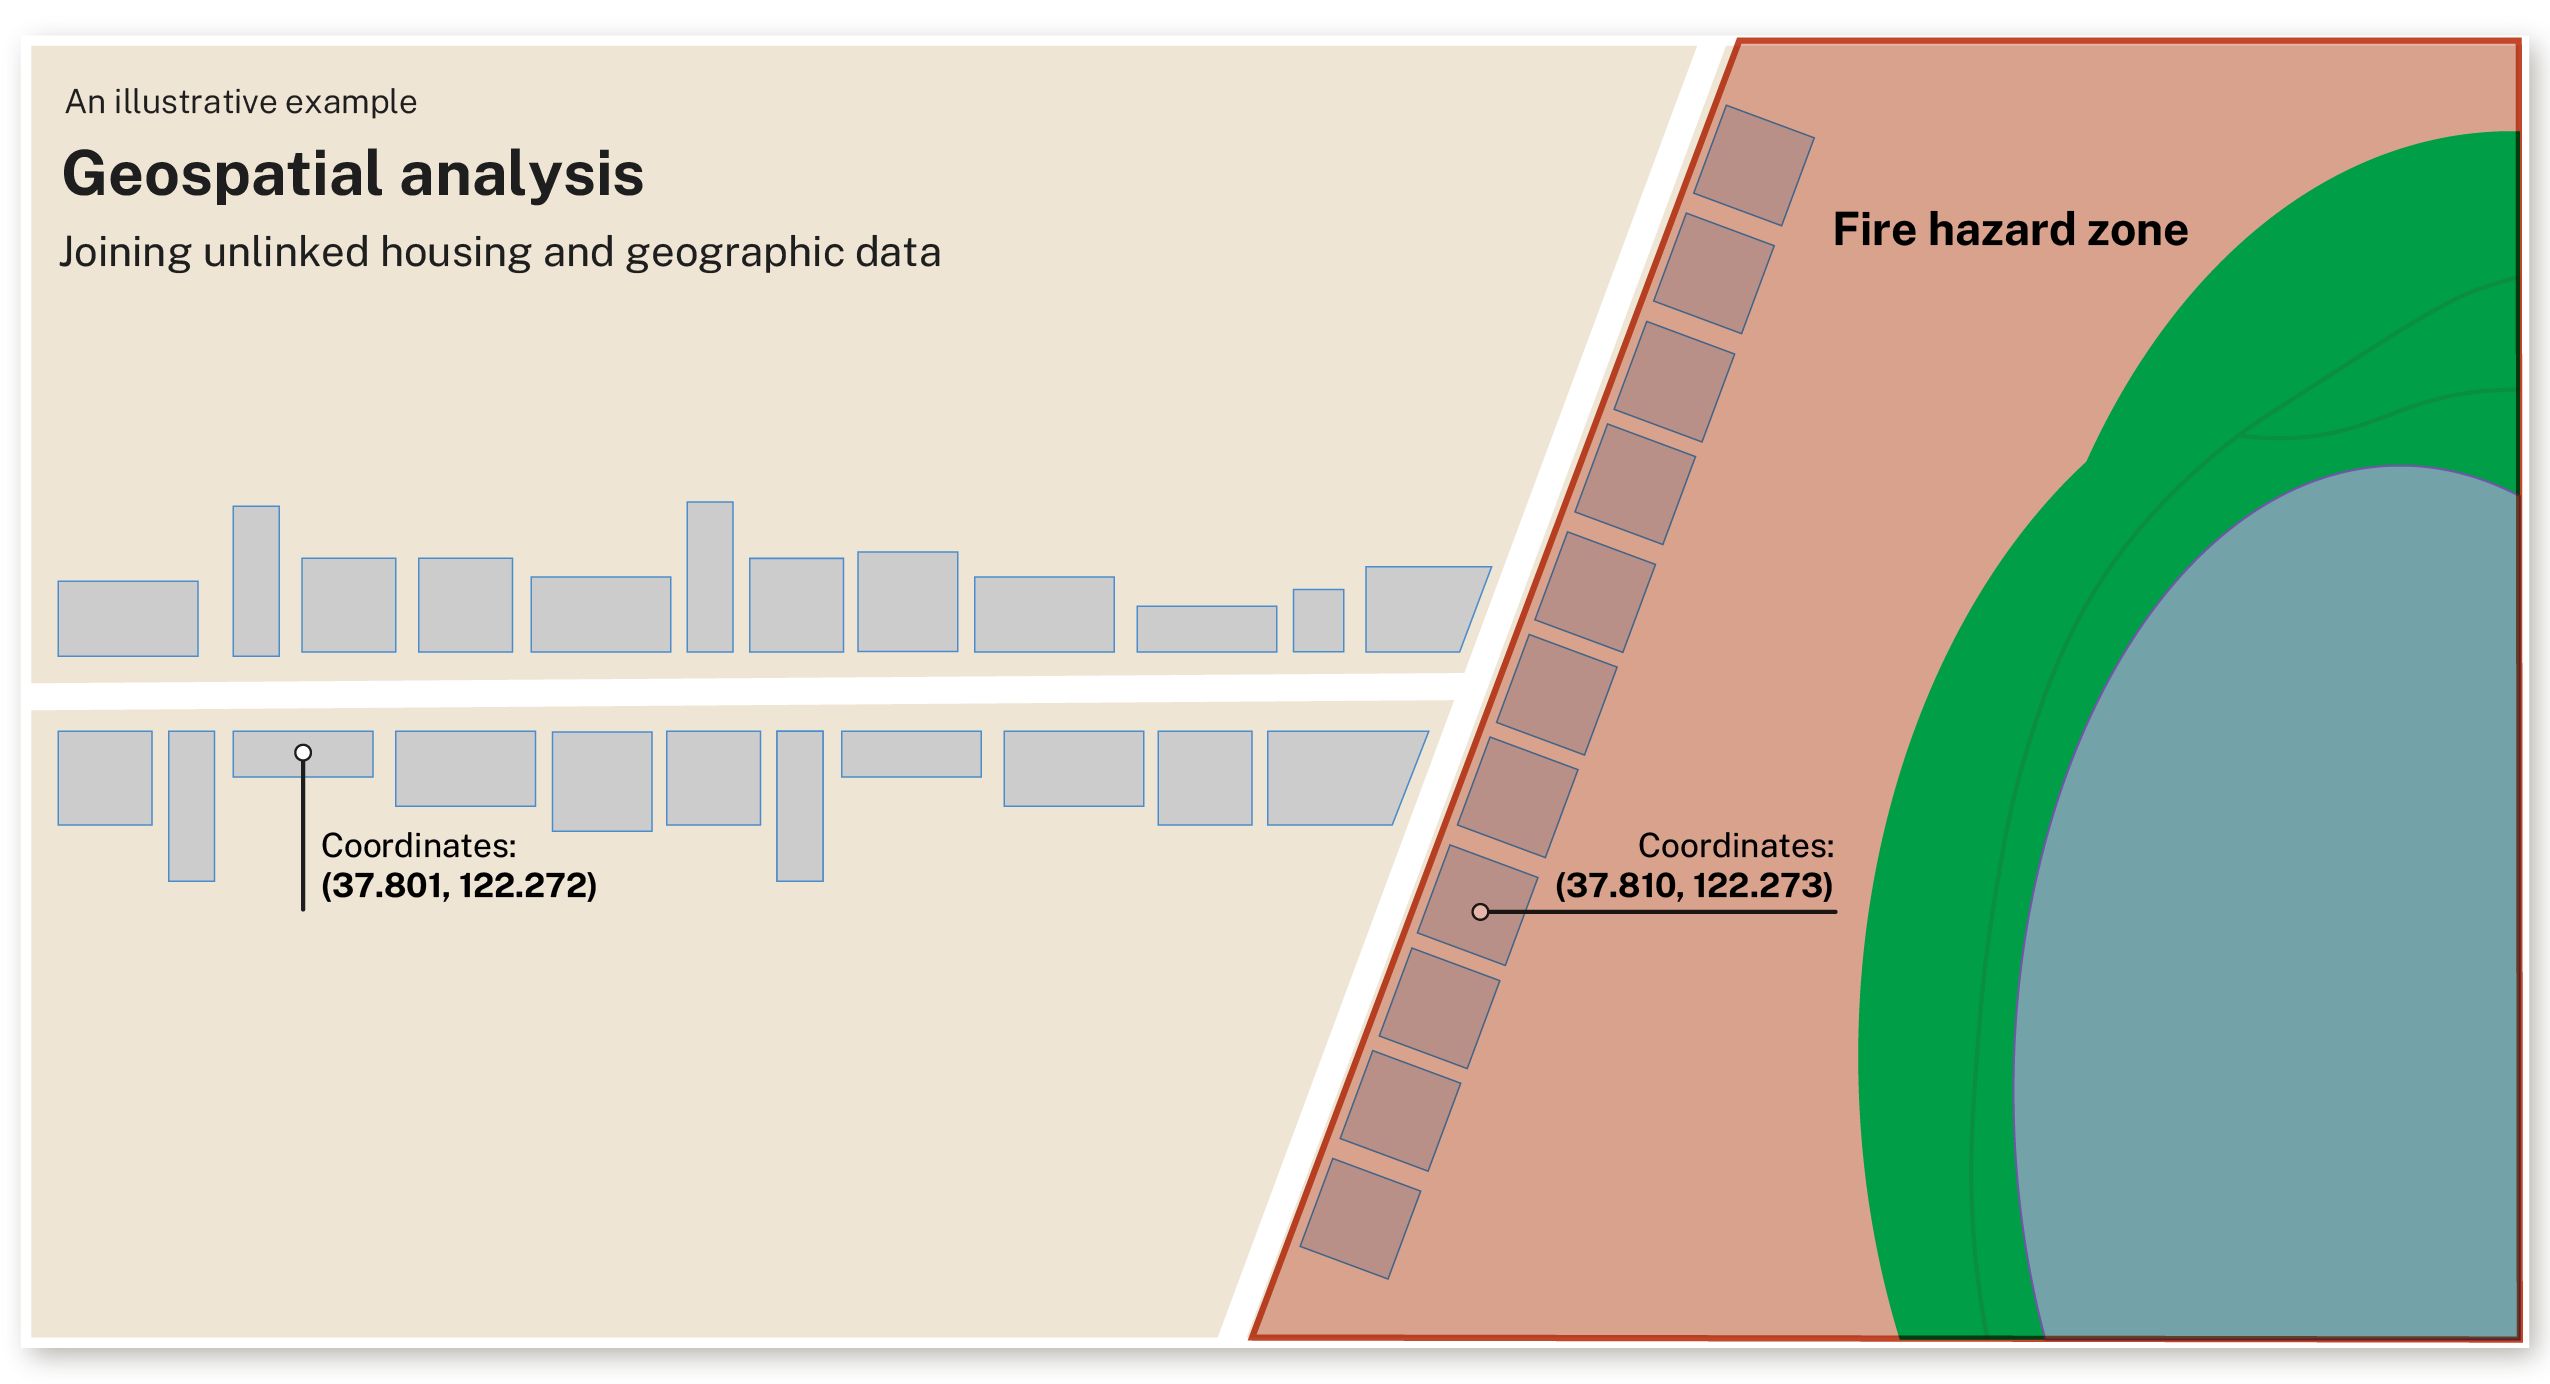
Figure 3. By mapping shape files representing sensitive geographic areas and project addresses, we can determine geographic eligibility for streamlining.
Automation
Lastly, we wanted Homestead to automate tasks that would otherwise take up large swaths of time, chipping away at the 90-day deadline HCD has to request corrections to reports. Repeatedly analyzing affordability using spreadsheets is one such task. Previously, inputs would need to be fed to a macro-enabled Excel file that would calculate affordability on a one-off basis for each individual unit size and county.
ODI and HCD worked together to convert logic from the Excel file to code. Using the logic and inputs from various government datasets, we are able to calculate affordable rent for every county, unit type/size, and year. The result is a dataset that we can build upon to have reliable, up-to-date, and visible affordability metrics.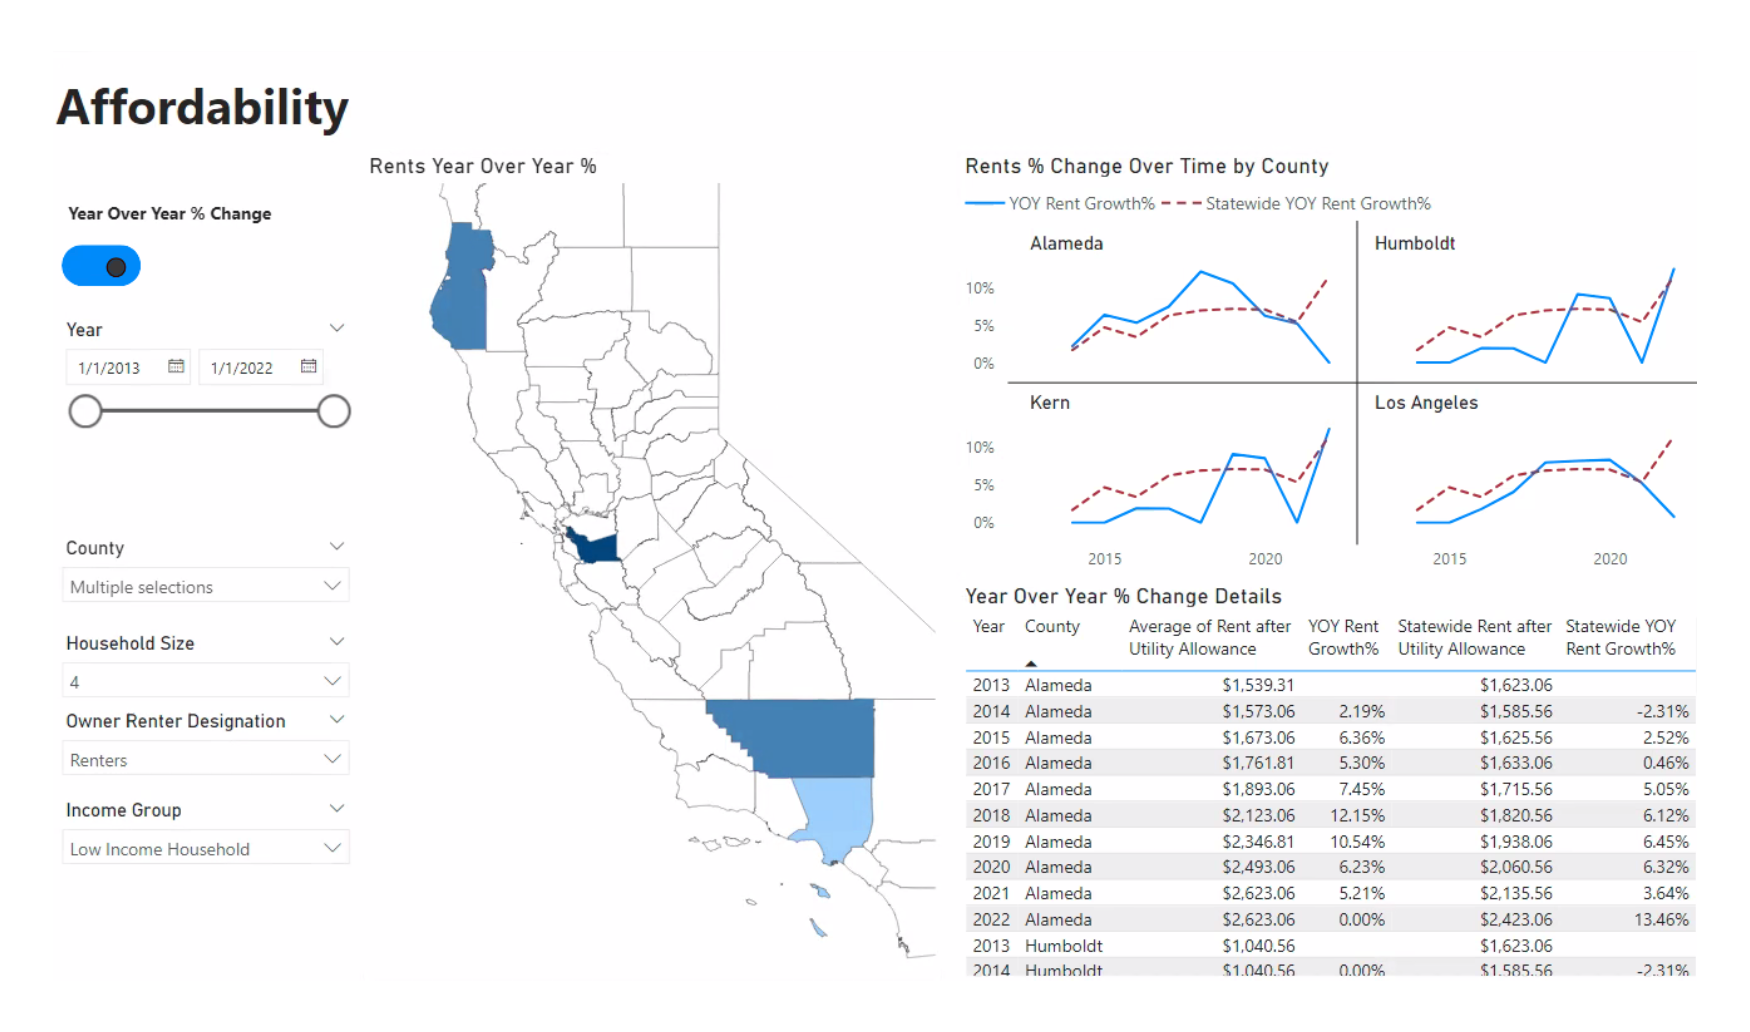
Figure 4. A screenshot of the affordability dashboard with filter controls, county-level housing cost changes, year-over-year trends, and table of housing affordability calculations.
Impact
Manual processes have costs beyond the actual hours spent on the review itself. Every hour of manual review takes away an hour from a deeper analysis and other tasks. Homestead helps reclaim time; the program runs overnight (~6 hour run-time), potentially saving HCD nearly 2,000 manual review hours every year.
“A manual data review process would require a full-time HCD staff member to work every hour for an entire year. That’s about 2,000 hours.” - HCD Sr. Housing Data Specialist
In the initial trial run, Homestead has demonstrated the following results:
- Tagged 400,000 projects over the last 5 years as eligible or ineligible for SB 423 streamlining (all future applications should be automatically flagged).
- 1,800 reported as SB 423 projects were identified as likely ineligible for streamlining or incorrectly reported.
- Provided new visibility into housing costs by county, income level, and unit size over the last decade. This covers all 58 counties across the state.
- Stitched together a timeline of each project’s milestones and produces a report for every jurisdiction’s time-to-build, allowing HCD to identify the areas with the most acute need for streamlining going forward.
Recommendations
Homestead relies on underlying housing data from jurisdictions. Therefore, we must prioritize making the data collection process as robust as possible. This includes more guidance for jurisdictions and validation in the reporting process, before eventually transitioning to a standardized reporting form (or open data standard). Additionally, Homestead’s output datasets are meant to be built upon and extended. The more the tool is accessible by HCD staff, the more assets (for example, graphs, metrics, or flags) can be used moving forward.
“Building more affordable housing faster” is a daunting mandate without the requisite tools. ODI and HCD are optimistic that better housing intelligence through Homestead is a vital step towards understanding and addressing the affordable housing shortfall in California.
References
California Department of Housing and Community Development. "Addressing a Variety of Housing Challenges." https://www.hcd.ca.gov/policy-and-research/addressing-variety-housing-challenges
Land use: streamlined housing approvals: multifamily housing developments, SB 423, California Legislature, Senate (2017). https://leginfo.legislature.ca.gov/faces/billNavClient.xhtml?bill_id=202320240SB423
Planning and Zoning Law: housing elements, AB 2653, California Legislature, Assembly (2022). https://leginfo.legislature.ca.gov/faces/billNavClient.xhtml?bill_id=202120220AB2653
Authors
Roles use the CRediT taxonomy.