 , Ian Rose, Summer Mothwood, Ram Kishore, Andrew King, Kathy Phillips, Kelly Madsen, Sudish Shrestha, Michael Phillips, Joe Zucco, Erik Long, Venkatesh Kankanala, Eric Johnson, Mark Matus, Chris Saur, Bryan Tsan-Tang, Samita Dhuri, Joshua Calderon, Janice Lall, Timmy Huynh, Alisha KR, Sowmya Simhadri
The Office of Data and Innovation (ODI) helped California Housing Finance Agency (CalHFA) use marketing data to see how campaigns affected loan applications.
 Download PDF
 https://zenodo.org/records/22016590
The opportunity
CalHFA runs online marketing campaigns to reach underserved groups. Its mission is to help more Californians afford homes. CalHFA has a lot of data that could be used to provide insight and improve those marketing campaigns. That data lived in separate systems and was siloed between teams which made it hard to analyze.
CalHFA came to ODI for help combining their marketing, social media, and mortgage data. This enriched data would improve data standards and reduce errors. As a result, the team could also see how well outreach worked and share findings with leadership.
The data pipeline
ODI worked with CalHFA using our training framework, the Modern Data Stack Accelerator (MDSA). We collaborated with CalHFA's experts to learn about their data and what it produced. We built data pipelines that integrated data sources, standardized definitions, and automated reporting. Together, we built data models that were real-world representations of their program areas. We showed how modern data practices could fill gaps and help deliver useful insights. Staff were trained to use modern tools like Azure DevOps, dlt (data load tool), Snowflake, dbt (data build tool), and Fivetran. At the end of the project, we gave the team recommendations and ideas for future work to ensure longevity.
Method
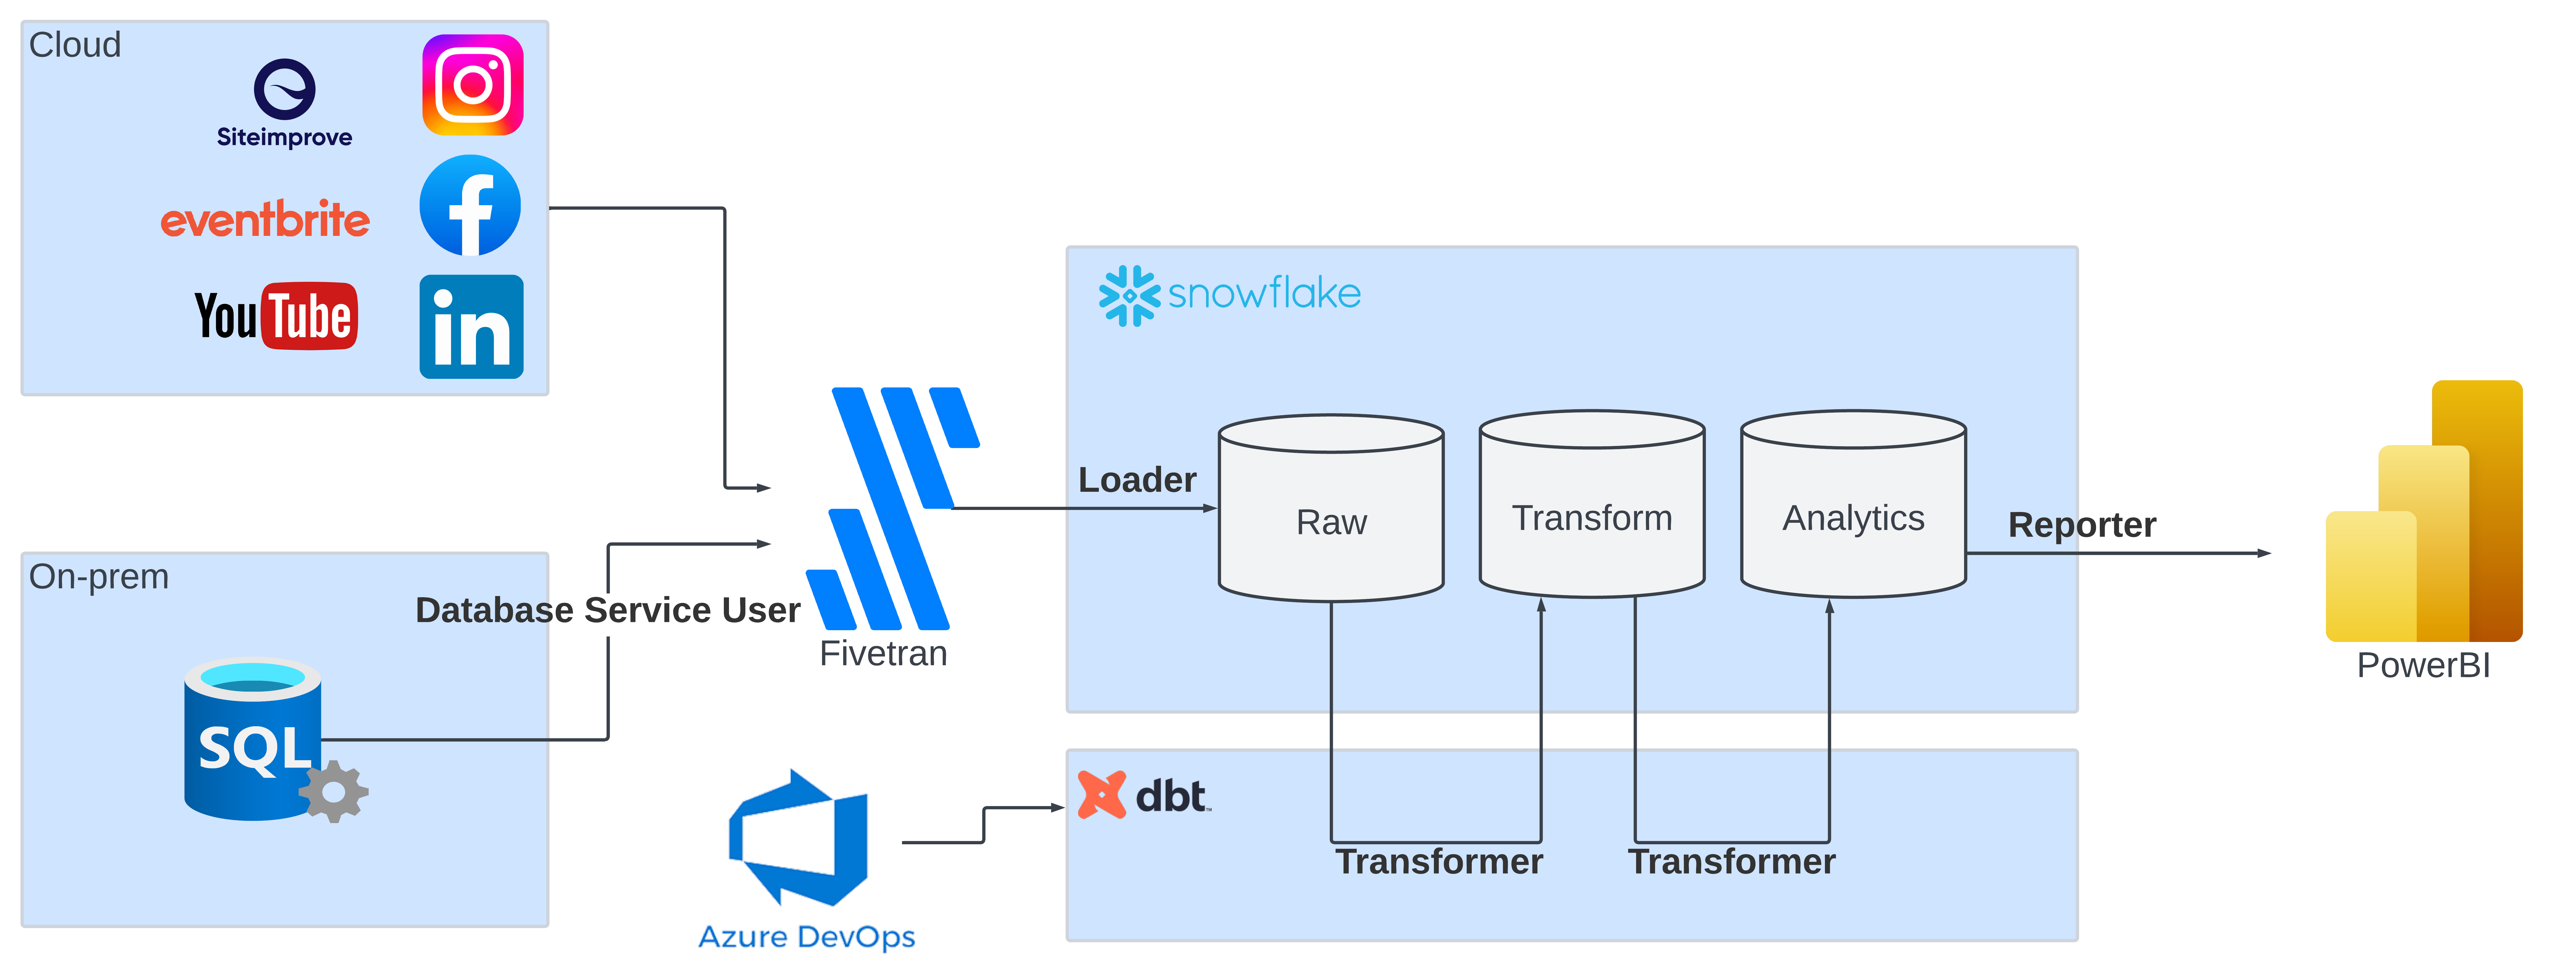
We built an automated, scalable, and cloud-based data pipeline that:
- Integrated data from 7 disparate sources using Fivetran and dlt
- Applied dbt as a SQL data modeling framework to cleanse, transform, and join data
- Deployed carefully tested and collaboratively approved code to production with Azure Pipelines
- Yielded 13 data tables consumable by end-users and reporting tools like PowerBI
Spotlight: Siteimprove and dlt
Siteimprove is a content intelligence platform that the CalHFA team was already using. This tool tracks user journeys across their public web pages. It shows exactly how visitors move from marketing landing pages to loan applications. Data like this was key to seeing whether online outreach led homebuyers to apply for loans.
Most data sources were ingested with Fivetran. Fivetran does not have a connector for Siteimprove, so we turned to dlt. It is a free open-source Python library for building data pipelines. As a team focused on innovation, this was an opportunity to evaluate dlt for potential future projects.
dlt handled 2 technical challenges well. First, the Siteimprove API paginates its responses, and dlt has built-in support for pagination. We reliably retrieved per-page data without having to write custom pagination logic. Second, dlt supports incremental loading out-of-the-box. This means that after the first full extract, future pipeline runs only grab new or updated data. This keeps the pipeline efficient and reduces extra load on the API and data warehouse.
Once loaded, Siteimprove data went through the same dbt modeling layer as other sources. There it was cleaned, transformed, and connected to campaign and loan data. This gave CalHFA a new view: they could trace the path from marketing impressions, to website visits, to loan applications.
Impact
The pipeline produced 3 proof-of-concept dashboards in PowerBI that showed the value of a unified data system. The first recreated CalHFA's Lender Scorecard. This was a manual Excel file updated twice a year, now it is an automated dashboard that’s refreshed daily. This rebuild process also uncovered errors in the original spreadsheet that were hard to find in a complex web of formulas. All of those errors are now fixed in the new PowerBI version. The second dashboard combined loan and training data by county and region. For the first time, staff can compare training and loan metrics with per capita views to account for population differences between counties and regions. The third dashboard gave the marketing team a tool to measure social media performance. It showed what channels and content were driving conversions.
This engagement wasn’t just about technology, it was also about people and process. ODI helped with both by delivering a clear technical solution and building staff confidence with it. The clear value of the solution led CalHFA to rethink and reorganize its data practices. The dashboards were proof of what's possible with a modern data stack in place. The training and system upgrades will help CalHFA keep building on this foundation. This will unlock the full potential of CalHFA data and help them better serve Californians.
Recommendations
CalHFA is now convening an enterprise-wide data governance effort in part because of this project. To ensure the success of this effort, ODI also recommends CalHFA:
- Establish a cross-functional data team or data working group empowering staff to own and manage data, standards, models, and reports
- Clarify and establish IT policies around doing data work at CaHFA
- Refine key metrics and onboard additional key data sources
- Invest in ongoing training to address skill gaps highlighted during the accelerator
Authors
Roles use the CRediT taxonomy.