Developing trustworthy monitoring data
We built an outlier detection tool to interactively assess environmental monitoring data quality.
The opportunity
The Department of Water Resources (DWR), housed within the California Natural Resources Agency, provides water for 27 million people and 750,000 farmland acres throughout the State of California. DWR relies on environmental monitoring data to produce accurate flood and water quality forecast models, manage floods, and comply with environmental laws.
Raw environmental monitoring data may contain errors and missing values for many reasons — such as environmental disruptions, instrument malfunction, power or transmission issues, and physical obstructions. However, unusual conditions can produce anomalous, but valid, data. Many state water contractors, flood-fighters, and members of the public use raw environmental data to make timely critical decisions. The challenge is to distinguish data outliers, or invalid data, from those that are valid but unusual. DWR staff invest significant time and resources reviewing raw data using combinations of ad-hoc automated and laborious, manual review methods that vary from group to group before using the data for decision-making.
Neither approach is viable. Using data of uncertain quality leads to poor decisions; manually and inconsistently reviewing data quality of raw data delays further analysis and time-critical decisions. We seek to solve these problems by developing and implementing a tool that easily, quickly, consistently, and transparently identifies spurious environmental data to improve confident decision making. Trustworthy environmental data leads to efficient workflows, better predictive modeling, provides analysis-ready data for research, and enables use of machine learning techniques with greater confidence in the validity of results.
Our approach
Detection tool
We developed an outlier detection tool that addresses the need for interactive data quality assessment. The core function of this tool is to provide a library of outlier detection tests and a convenient user interface to execute them. The application offers a variety of configurable outlier detection algorithms, each with customizable parameters that users can adjust before test execution. The tool supports flexible re-execution of tests, whether to correct parameter errors or to explore alternative parameter settings. At the time of writing, 9 tests have been implemented, most suggested by DWR’s internal Outlier Detection Test Best Practices document (Department of Water Resources, 2026). These tests encompass both basic quality checks like gross range validation for boundary violations and value gap detection for missing entries, as well as more advanced statistical approaches such as Z-score analysis and the Tukey interquartile range method. The basic checks can be implemented as unsupervised steps, while some benefit from supervision by subject matter experts. More tests can be added in the future to support new data quality standards or techniques.
Built using open-source Python libraries, the tool implements a human-in-the-loop approach that allows users to iteratively refine outlier detection parameters and validate results through data visualization. The backbone of the user interface is Shiny for Python (The Shiny development team, 2025), an extensible library for creating dynamic applications. One feature of this library is that it creates a browser-based interface, enabling broad application portability.
During tool development, we found that many different data formats are used within DWR. Staff often work with tabular data (generally in CSV format) in Microsoft Excel and various internal databases, but no single standard exists. As a result, the tool was built to accept CSV files with heterogeneous schemas as its primary input format. Since CSVs are inherently text-based, the tool also devotes significant effort to interpreting data types in the uploaded file. Various formats of dates, timestamps, and numbers are all interpreted from the raw text data. We also enabled teams to configure their own file formats within the tool, allowing them to control how data types are interpreted, rename columns, and pass custom file reading options.
Usability testing
Usability testing allows a team to discover opportunities for improvement in their product. It involves prompting people to use a tool, and noting where they use it easily and where they struggle with it. Without usability testing, teams risk developing software that doesn’t meet their users’ needs or expectations. To learn more about this practice, see Moran (2025).
For this project, we conducted an interface design evaluation and user research on the outlier detection tool. First, we evaluated the tool using general-purpose design heuristics aimed to improve the user interface. Next, we conducted 2 rounds of user research. For the first round, we asked 7 DWR staff across three divisions for individual testing sessions with an ODI researcher. We asked each staff member to use the tool to detect outliers and missing values in environmental monitoring data. As they attempted this task, we recorded and took notes during each session. Then we synthesized data from the tests into findings and recommendations.
Our synthesis produced 28 recommendations for changes to the tool. We prioritized these items, based on their level of effort and level of impact, into a backlog of prioritization categories (high, medium, and low priority). To improve the tool, and build trust with the users, we incorporated 13 of the recommended changes into the tool (including all but one of the high priority items). Once these changes were implemented, we conducted a second round of user testing, where we asked 3 staff to record themselves interacting with the improved tool and to send us the recording. This round produced a total of only 2 recommendations, both of which were categorized as low-priority tasks.
Outside of suggestions to improve the user interface, functionality, and data formats, we also uncovered the following cultural issues during our usability testing:
- The DWR Outlier Detection Group's recommended tests have not yet been fully adopted in staff’s day-to-day QA/QC work. This may be due to lack of awareness of the recommended tests, or limitations of current data analysis and storage flexibility.
- Environmental monitoring data work groups, or producers, use varying data review methods, including outlier detection, across DWR divisions. Prioritizing a standard methodology requires support for policy implementation and change management at the leadership level.
- Most producers do not publish quality-controlled data automatically or in real-time, despite intentions of the Open and Transparent Water Data Act. Users must access quality controlled data by specifically requesting it from a data producer.
Impact
Here we describe the impact of this collaborative effort.
- Produces high quality data for water operations, forecast modeling, and research. Integrating best practices for outlier detection into data analysis pipelines will improve data quality, helping DWR meet its mission to reliably provide water to the people of California while protecting the natural environment. It will reduce the time between data acquisition and robust data so that fewer field visits are necessary to check real-world conditions. Hydrologic modelers will be able to use the data as inputs to water resource management forecasts and analysis with much less labor and greater confidence. Researchers can rely on timely, standardized datasets for analysis and synthesis studies and to use these data to build machine learning models.
- Saves hundreds of hours of DWR scientific staff time. More than 21 work units within DWR collect and manage detailed water monitoring data. These amount to ~100 million data points per year. The tool will enable a standardized data-review workflow, through which data collectors will save time reviewing data and data users will save time cleaning data. This level of data review hasn’t been completely satisfied with current resources. Staff spend less time manually vetting and compiling data for reports, policy recommendations or other analyses.
- DWR is better equipped to comply with legislative mandates. DWR is mandated by AB 1755, the Open and Transparent Water Data Act, to make water-related and data of known quality publicly available in easily used and accessible forms. The results of this collaboration enables DWR to more fully comply with the mandate, producing higher-quality data at lower cost to the state. Similarly, DWR Water Resources Memo 60 (WREM 60) sets department policies and procedures to assure that quality assurance is used in data collection and management activities. It stipulates that all water-related data is scientifically sound, legally defensible, comparable and compatible with State and federal agencies, and is properly documented.
- Enables better decision-making. DWR is subject to several water rights and environmental regulations, such as, State Water Board Decision 1641 (2000), that mandate significant water management actions to protect water quality and quantity based on real-world conditions. These actions are set in motion in response to real-time environmental data. This collaboration will enable DWR water managers to deliver water to customers more efficiently and effectively (save money and other resources). Water contractors can confidently make decisions about water treatment that save treatment resources and improve the public’s satisfaction with water delivery. Data users can be confident that data has been reviewed completely and consistently.
- DWR produces high quality data to the public. This fosters a culture of excellence for conducting research and co-producing analysis with others. The first goal of the DWR Strategic Plan (2023) is to be an employer of choice, which means attracting, developing, and supporting employees to do the best work possible and with the necessary tools to do it.
- Serves as a framework for different types of continuous monitoring data. This framework can be easily extended to any one of the over 100 unique types1 of continuous water, soil, and atmospheric data published in near real-time. Within these types, location-specific or time-specific tests can be customized to accurately discern anomalous data in the presence of local variability. Customized settings can capture institutional knowledge so that future staff can be brought on board with reduced need for specialized training. This will encourage consistent data evaluation, standardization, compatibility, and interoperability.
1 See environmental variables here: https://cdec.water.ca.gov/misc/senslist.html
Recommendations
Transitioning to a fully automatic pipeline
This is the first step toward DWR's ultimate goal of producing an automatic data processing pipeline that processes near real-time data using standardized data review methods, publishes the raw data together with the reviewed and quality-controlled data in one, easy-to-use data repository using a standard data format, and identifies outliers, missing values, and errors using an informative flag. Implementing this requires a consensus-based approach on data standards.
Here are our recommendations for transitioning to a fully automatic pipeline:
- Implement and prioritize data quality and data publication policies that set standardized methodologies for review methods, data formats, and data repositories as well as standard time frames to make reviewed data publicly findable and accessible. These policies would represent a minimum standard, with staff empowered to innovate beyond the minima.
- Socialize this policy. Through usability testing, we found that some groups do review data in their day-to-day work, but not necessarily by using the tests recommended by the Outlier Detection Test Best Practices document (Department of Water Resources, 2026). This may be due to lack of awareness of the recommended tests. Some groups were effectively performing some of the data quality review tests, through other means. Providing a tool with this set of tests easily accessible will reduce thresholds to wide adoption throughout the organization.
Incorporating machine learning methods
We developed a prototype machine learning model to detect outliers in water quality data. As a test, we attempted to automatically identify outliers in 35 years of pH data, from 1989 to 2024, from the Barker Slough Pumping Plant (BKS).
The BKS data are available on CDEC, which serves raw data without any information about data quality. In order to train a supervised machine learning model, which relies on labelled data, we created a synthetic label for poor quality data by using the tool to identify outliers via 6 statistical tests. We also added noise by assigning poor quality labels to other data points at random. We labelled the rest of the data as high quality.
Other groups successfully have used machine learning models to automatically identify poor water quality data. For example, Talagala et al. (2019) used time series characteristics, together with a machine learning model called k-nearest neighbors, to successfully identify outliers in water quality data taken in the Mackay-Whitsunday region of northeastern Australia.
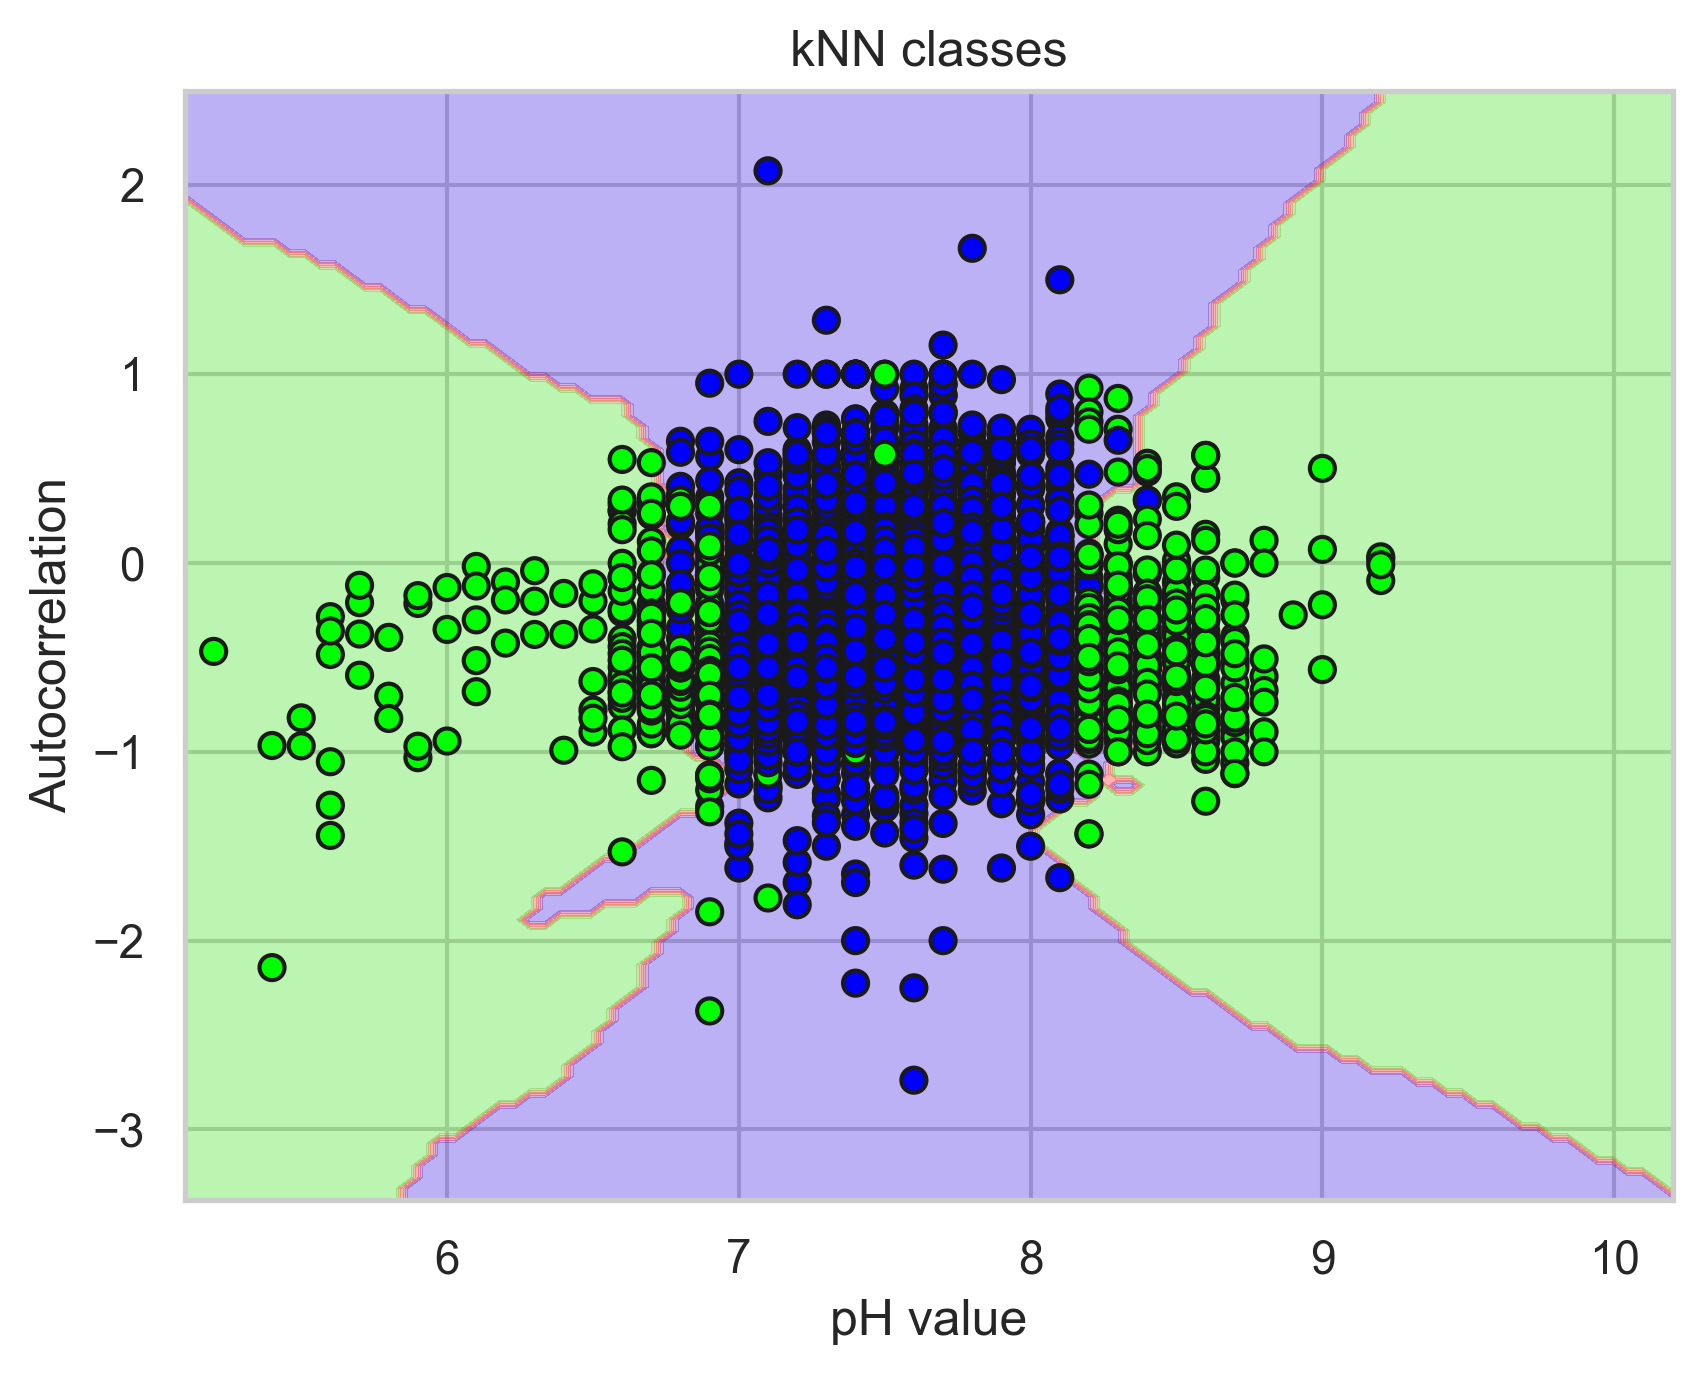
We followed their approach by deriving 6 simple features from the BKS time series data — such as the autocorrelation of the pH during a one-week rolling window with the week prior — using the Python package tsfresh (v0.21.0; Christ et al. 2018). Next, we split the 35-year data set into a training set, consisting of the first 24.5 years of data, and a testing set, consisting of the rest. Finally, we used a k-nearest neighbors model, with k=3, to identify outliers. The model identifies outliers by first plotting the features derived from the training data, together with their labels, in a 6-dimensional feature space. To identify outliers in real-time data, for which we do not know the label, the model plots a data point in the hyperspace, identifies three proximate data points, determines the majority label, and ascribes this label to the real-time data. See Figure 1.
Here are our recommendations for transforming this prototype into a robust machine learning model, used in production, to automatically identify outliers in water quality data:
- Update the historical data in CDEC with labels that identify the quality of each data point. A more sophisticated approach includes informative labels that describe poor quality data (e.g. a power outage or an unphysical reading). A self-consistent labelled dataset is necessary for training a machine learning model.
- Research methods to create a sufficiently large training dataset. Here, we used data from one station to train the model. Extending the training dataset to all stations may introduce too much variation in the data and produce noisy predictions. Instead, we recommend grouping stations with similar behavior. One approach is to create geographic groups of stations. Another is to group stations by climate classification.
- Develop infrastructure needed to conduct machine learning experiments. Store the data in a cloud computing environment and co-locate the code and compute. Performing the analysis in the same place as the data improves speed and eliminates the costly and time-consuming practice of moving data back and forth between an external database and a local machine. Ideally, use a tool to track experiments (e.g. MLflow).
Developing an analysis-ready dataset
Rich, complex, analysis-ready datasets serve as a benchmark for machine learning models. Researchers can develop multiple predictive models, test it on the same dataset, and compare performance metrics. This accelerates model development. Readily-available datasets also attract modelers to the field.
Here are our recommendations for creating and openly publishing an analysis-ready dataset with DWR environmental monitoring data:
- Identify the data provenance. Ensure the metadata keywords include information about the data provenance (e.g. the instrument and sensor type, the last the time the instrument was physically calibrated). See Gebru et al. 2018.
- Use a standardized and universal format for metadata keywords. This enables interoperability between state and federal datasets. See, for example, the harmonize-wq Python package (Bosquin and Mullin, 2024).
References
Bousquin, J., & Mullin, C. A. (2024). harmonize-wq: Standardize, clean and wrangle Water Quality Portal data into more analytic-ready formats. Journal of Open Source Software, 9(102), 7305. https://doi.org/10.21105/joss.07305.
Christ, M., Braun, N., Neuffer, J., & Kempa-Liehr, A. W. (2018). Time series feature extraction on basis of scalable hypothesis tests (tsfresh–a python package). Neurocomputing, 307, 72-77. https://doi.org/10.1016/j.neucom.2018.03.067.
Department of Water Resources (2023). DWR Strategic Plan. https://water.ca.gov/-/media/DWR-Website/Web-Pages/About/Files/Publications/DWR-Strategic-Plan.pdf.
Department of Water Resources (2026). Outlier Detection Test Best Practices (DWR Document Control Number: DWR-1-BST-005). https://water.ca.gov/-/media/DWR-Website/Web-Pages/Library/Files/Public-Forms/DWR1BST005v12Outlier-Detection-Best-Practicesfk.pdf.
Gebru, T., Morgenstern, J., Vecchione, B., Vaughan, J. W., Wallach, H., Iii, H. D., & Crawford, K. (2021). Datasheets for datasets. Communications of the ACM, 64(12), 86-92. http://dx.doi.org/10.1145/3458723.
Moran, K. “Usability (User) Testing 101.” nngroup.com, 11 September 2025, https://www.nngroup.com/articles/usability-testing-101/.
State Water Resources Control Board (2002). State Water Board Decision 1641 (2000). https://www.waterboards.ca.gov/waterrights/board_decisions/adopted_orders/decisions/d1600_d1649/wrd1641_1999dec29.pdf.
Talagala, P. D., Hyndman, R. J., Leigh, C., Mengersen, K., & Smith‐Miles, K. (2019). A feature‐based procedure for detecting technical outliers in water‐quality data from in situ sensors. Water Resources Research, 55(11), 8547-8568. http://dx.doi.org/10.1029/2019WR024906.
The Shiny development team. (2025). Shiny for Python (Version 1.4.0) [Computer software]. https://shiny.posit.co/py/.
Code
Authors
Roles use the CRediT taxonomy.